Introduction To Websockets:
WebSockets: the unsung heroes delivering constant stock data seamlessly. These dynamic channels offer real-time market insights, yet handling this continuous flow can be challenging for newcomers. In this guide, we’ll navigate the intricacies of storing this dynamic data in 1-minute (OHLC) candlestick format, providing a robust foundation for your algo trading strategies. Follow my step-by-step approach to effortlessly store data for multiple symbols, and adapt the code for your machine with minimal changes. Get set to elevate your trading game with the unstoppable force of WebSockets!
Data Source:
WebSockets act as the vital conduit for accessing real-time stock data with ease that’s why a lot of financial firms use them extensively. Whether you’re dealing with brokers, data providers, or exchanges such as Binance, each extends a WebSocket API, provided with sample code for a smooth connection.
In this guide, we’ll dive into the hands-on details, specifically using Kotak Neo Broker data in the Indian stock market. I have a post where we discussed Kotak neo API integration. This focus ensures clarity, but rest assured, the principles apply broadly to any WebSocket source. Now, let’s embark on the journey of transforming this continuous data into a 1-minute candlestick format, paving the way for potent algo trading strategies.
Here i am getting my websocket data in this format.
					Received message: [{'ftm0': '01/01/1970 05:30:02', 'dtm1': '14/11/1971 13:36:38', 'fdtm': '19/01/2038 08:44:08', 'ltt': '19/01/2038 08:44:08', 'v': '2147483648', 'ltp': '21894.5500', 'ltq': '2147483648', 'tbq': '2147483648',
                     'tsq': '2147483648', 'bp': '21474836.4800', 'sp': '21474836.4800', 'bq': '2147483648', 'bs': '2147483648', 'ap': '21474836.4800', 'lo': '21474836.4800', 'h': '21474836.4800',
                     'lcl': '21474836.4800', 'ucl': '21474836.4800', 'yh': '21474836.4800', 'yl': '21474836.4800', 'op': '21474836.4800', 'c': '21647.2000', 'oi': '2147483648', 'mul': '1', 'prec': '2', 'cng': '247.3500',
                     'nc': '1.1426', 'to': '46116860184273880.0000', 'name': 'sf', 'tk': '26000', 'e': 'nse_cm', 'ts': 'NIFTY'}]
With this data, we’ll pull out the Live Trading Price (LTP) and organize it neatly in a dictionary. This paves the way for effortlessly building our candlestick database, as you’ll see in the code snippet below.
					live_data = {}
def on_message(message):
    global live_data
    try:
        #print(f"Received message: {message}")
        for i in message:
            live_data[i['tk']] = i['ltp']
Now Our live_data dictionary will store data like this:
					{'1': '72374.5200', '26009': '47666.4500', '26000': '21828.1500'}
'''First Keys are tokens for different
   stocks and dats stored is lowest traded price'''
Convert websocket TickData Data into OHLC for single Symbol:
Let’s kick off by storing data for a single symbol first. This way, you can grasp the fundamental structure of the code and understand how it seamlessly operates.
-
At the onset, it’s crucial to set our start time and current time. This ensures our code begins capturing values at the start of the next minute. As depicted in the code, we fetch data from the commencement of the upcoming minute, aligning it seamlessly with our TradingView streaming.”
- “Next on our checklist is the creation of an empty data frame. This serves as the canvas to store our candlestick data, allowing us to neatly organize our OHLC (Open, High, Low, Close) information within this structured framework.
Code Below:
					import datetime
import time
import pandas as pd
import plotly.graph_objects as go
# Function to get the next minute's start time
def get_next_minute_start():
    now = datetime.datetime.now()
    next_minute_start = datetime.datetime(now.year, now.month, now.day, now.hour, now.minute, 0)
    if now.second >= 59:  # Adjust the starting point based on your requirement (e.g., start from the current minute if second is 30 or more)
        next_minute_start += datetime.timedelta(minutes=1)
    return next_minute_start
# Function to format time in HH:MM:SS
def format_time(current_time):
    return current_time.strftime('%H:%M:%S')
global candlestick_data
candlestick_data = pd.DataFrame(columns=['timestamp', 'open', 'high', 'low', 'close'])
Moving ahead, our code employs a while loop to continuously store LTP (Live Trading Price) values in a user-defined list for a span of 60 seconds. Post this interval, the code dynamically calculates OHLC (Open, High, Low, Close) data from the accumulated LTP values. This OHLC data is then seamlessly incorporated into our candlestick dataframe. To visualize these real-time changes, the code ensures the automatic plotting of the candlestick chart each time new data is updated in our dataframe.
					# Initialize variables for storing LTP values over 60 seconds
ltp_values = []
# Initialize start_time to the next minute start
start_time = get_next_minute_start()
print(start_time)
# Run continuously
while True:
    token = '26000'
    # Simulating live data stream (replace this with your actual data retrieval logic)
    # For simplicity, we are using a random value as LTP.
    ltp = float(get_live_data(token))
    #print(ltp)
    # Append the LTP value to the list
    ltp_values.append(ltp)
    # Check if 60 seconds have passed
    if datetime.datetime.now() >= start_time + datetime.timedelta(seconds=60):
        # Calculate OHLC values
        open_price = ltp_values[0]
        high_price = max(ltp_values)
        low_price = min(ltp_values)
        close_price = ltp_values[-1]
        # Print OHLC values and current time
        print(f"{format_time(start_time)} - Open: {open_price}, High: {high_price}, Low: {low_price}, Close: {close_price}")
        new_data = pd.DataFrame({
            'timestamp': [start_time],
            'open': [open_price],
            'high': [high_price],
            'low': [low_price],
            'close': [close_price]
        })
        candlestick_data
        # Concatenate the new data with the existing candlestick_data
        candlestick_data = pd.concat([candlestick_data, new_data], ignore_index=True)
        fig = go.Figure(data=[go.Candlestick(x=candlestick_data['timestamp'],
                                         open=candlestick_data['open'],
                                         high=candlestick_data['high'],
                                         low=candlestick_data['low'],
                                         close=candlestick_data['close'])])
        fig.show()
        # Clear the list for the next 60 seconds
        ltp_values = []
        # Update start_time for the next 60-second interval
        start_time = get_next_minute_start()
    # Wait for the next iteration
    time.sleep(.5)
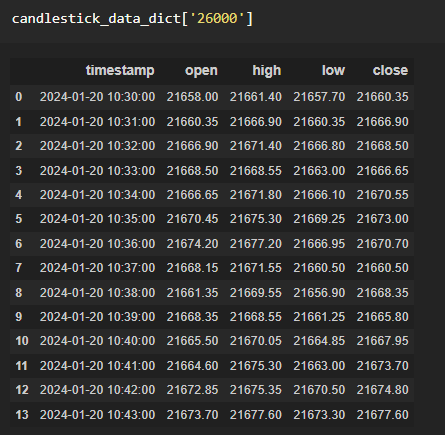
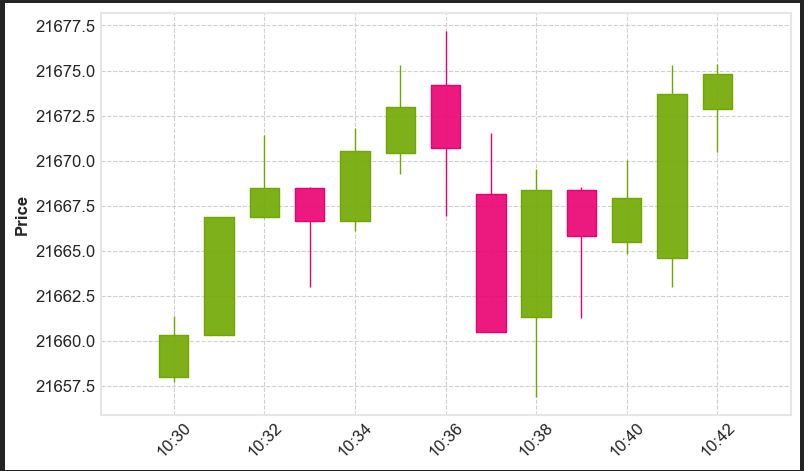
Here we will store the OHLC data of Nifty50 whose token is [‘26000’]. The resulting data frame and Candlestick Chart Is Shown Below:
Convert Websocket Tick Data to (OHLC) for Multiple symbols:
To convert websocket TickData to candlesticks(OHLC) for multiple symbols, we adopt a dictionary-based approach. For each symbol, we create dedicated dictionaries for both the candlestick dataframe and LTP values. Once a candle is completed, we transfer these values to their respective dictionaries, ensuring that data for each token is stored separately. The token serves as the key for each dictionary, neatly organizing the information. For a comprehensive walkthrough of the code, you can refer to my YouTube video, linked below.
					# Initialize a dictionary to store candlestick data for each token
candlestick_data_dict = {}
# Initialize variables for storing LTP values over 60 seconds
ltp_values_dict = {}
# Shared start time for all tokens
start_time_dict = {}
# List of tokens
tokens = ['26000', '26009', '1']  # Add more tokens as needed
# Initialize data structures for each token
for token in tokens:
    candlestick_data_dict[token] = pd.DataFrame(columns=['timestamp', 'open', 'high', 'low', 'close'])
    ltp_values_dict[token] = []
    start_time_dict[token] = get_next_minute_start()
while True:
    for token in tokens:
        # Simulating live data stream (replace this with your actual data retrieval logic)
        # For simplicity, we are using a random value as LTP.
        ltp = float(get_live_data(token))
        ltp_values_dict[token].append(ltp)
        # Check if 60 seconds have passed for the specific token
        if datetime.datetime.now() >= start_time_dict[token] + datetime.timedelta(seconds=60):
            # Calculate OHLC values
            open_price = ltp_values_dict[token][0]
            high_price = max(ltp_values_dict[token])
            low_price = min(ltp_values_dict[token])
            close_price = ltp_values_dict[token][-1]
            # Print OHLC values and current time
            print(f"{format_time(start_time_dict[token])} - Token: {token}, Open: {open_price}, High: {high_price}, Low: {low_price}, Close: {close_price}")
            # Create a new row of data
            new_data = pd.DataFrame({
                'timestamp': [start_time_dict[token]],
                'open': [open_price],
                'high': [high_price],
                'low': [low_price],
                'close': [close_price]
            })
            # Concatenate the new data with the existing candlestick_data for the token
            candlestick_data_dict[token] = pd.concat([candlestick_data_dict[token], new_data], ignore_index=True)
            # Clear the list for the next 60 seconds
            ltp_values_dict[token] = []
            # Update start time for the next 60-second interval for the specific token
            start_time_dict[token] = get_next_minute_start()
    # Wait for the next iteration
    time.sleep(.5)
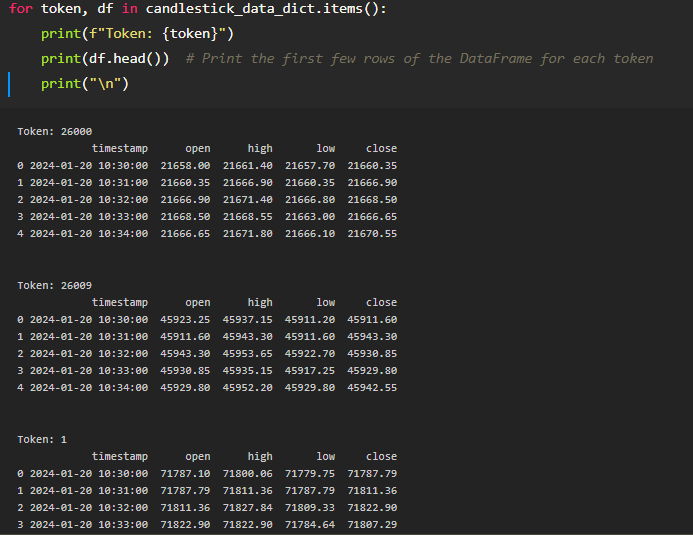
Resulting Candlestick_dataframe is Shown Below:
Conclusion:
In conclusion, we’ve successfully transformed WebSocket data into actionable insights, creating dynamic candlestick charts. This journey equips you with technical know-how for live trading data and building powerful algo trading strategies.
You can enhance efficiency by implementing this process in threading and running data storage parallel to other tasks. Check my video for a detailed demonstration.
Checkout my RSI Strategy Backtesting post here.
Your support matters. If you found this guide helpful, share it with fellow traders and developers, fostering collaboration in the exciting world of algorithmic trading. Thank you!

