Significance of Support and Resistance!
When I started trading in 2018 I didn’t know that technical analysis existed. But With Continuous losses, I started reading books about technical analysis and how to use it for trading. one of the most important things in technical analysis is how to identify support and resistance.

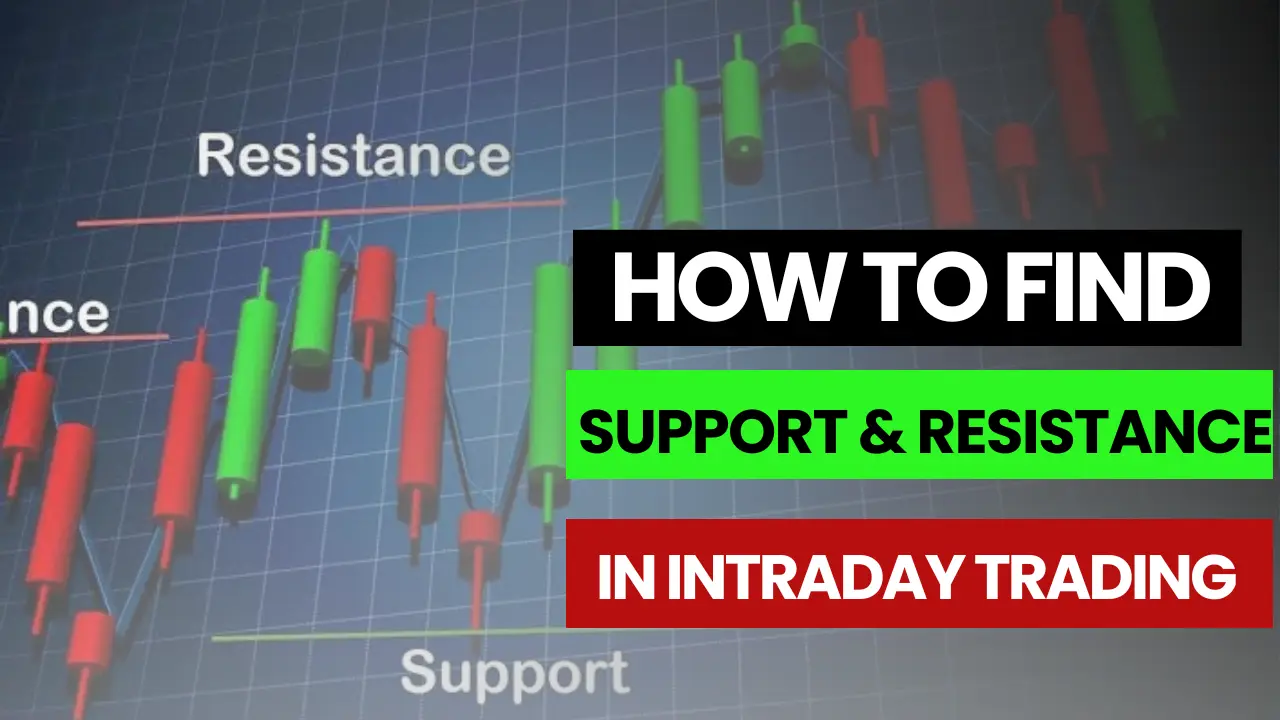
Support and resistance act like hidden guides in trading, influencing how prices move. Think of support as a floor where buyers step in, slowing down a drop, and resistance as a ceiling where sellers gather, slowing down an uptrend.
These levels help traders in two main ways.
- First, they show potential buying or selling points. If prices bounce up from support, it’s a chance to buy. If they break through resistance, it’s an opportunity to sell.
- Second, support and resistance are like safety nets. Placing stops just below support or above resistance can limit losses if prices break through, protecting your money.
Consider them even more powerful when combined with other indicators. If support lines up with a signal to buy, it strengthens the case for an upward move. If resistance pairs with a signal to sell, it supports the idea of a downward trend.
While they’re not foolproof, support and resistance are handy tools for understanding market moves. But they play a crucial role in identifying potential trends.
Best way to Identify Support and Resistance:
This methods offers Best Ways to Find support and resistance levels with minimal effort.
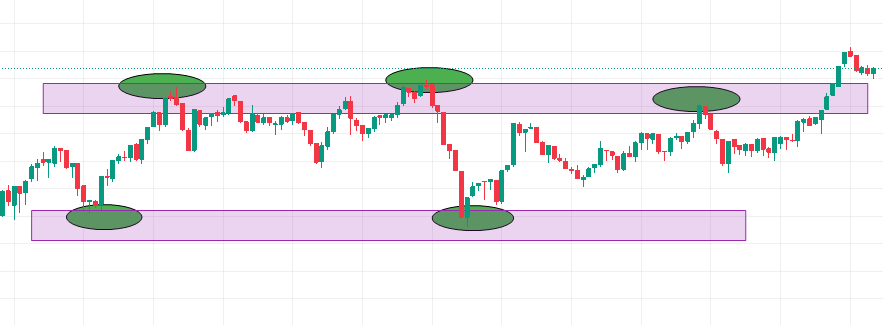
Begin by opening a candlestick chart, as depicted in the image below. Identify areas where the price revisits consistently without making substantial moves beyond that range.
Choose two or three such points to establish your support and resistance. For optimal results, consider using higher time frames than your current timeframe.
Once you’ve identified these points, connect them using either a rectangle or a horizontal line. This connection forms the basis of your support and resistance strategy, providing a visual guide for potential market movements. This uncomplicated technique allows traders to efficiently identify key levels without extensive analysis, making it accessible for traders of various experience levels.

Another effective way to spot support and resistance levels is by employing trendlines. Start by identifying the current trend in the market—whether it’s upward, downward, or sideways. Once determined, draw a straight line connecting the lows for an upward trend (support) or the highs for a downward trend (resistance), extending the line to the right. In a sideways trend, draw lines connecting both the highs and lows as shown in the image below. It’s crucial to validate these trendlines by ensuring they touch multiple points along their path, indicating more substantial support or resistance. Consider using higher time frames for confirmation and adjust the trendlines periodically to accommodate any shifts in market trends. This method capitalizes on the natural flow of the market, providing a visual guide for identifying key levels.

While this methods offers a simple way to identify support and resistance levels, it’s important to exercise caution and consider certain factors.
Keep in mind that no approach in trading guarantees 100% accuracy. Market conditions are dynamic, and prices may not always adhere strictly to our support and resistance levels. It’s essential to adapt to market conditions without emotionally attaching ourselves to our levels Because the Market is supreme and technical analysis is a probability game.
Also, consider the impact of sudden market events or news releases that can disrupt your patterns. Always stay informed and be prepared to adapt yourself to market conditions.
Conclusion:
In conclusion, identifying support and resistance using These methods offers a straightforward visual method for understanding key levels in trading. By connecting lows and highs, traders can recognize potential areas of price influence. However, it’s important to supplement this approach with careful analysis and adaptability to changing market conditions, as no method guarantees absolute accuracy in the dynamic world of trading. You can check out my Other posts here.


