Introduction
Stock price prediction is a complex yet intriguing task for traders, investors, and data scientists. With the advent of deep learning techniques like Long Short-Term Memory (LSTM) networks, making informed stock market predictions has become more accessible. In this blog, we explore how to use Streamlit, Yahoo Finance, and TensorFlow to build an interactive stock price prediction application. Additionally, we will discuss the importance of technical indicators, data preprocessing, and visualization techniques to improve accuracy and usability.

Why LSTM for Stock Price Prediction?
LSTM networks are a type of recurrent neural network (RNN) designed to handle sequential data like stock prices. Unlike traditional machine learning models, LSTMs can retain information from previous time steps, making them ideal for forecasting stock prices.
visit here for github repository.
Key Benefits of Using LSTM:
- Handles long-term dependencies in time series data.
- Reduces vanishing gradient issues.
- Can learn patterns from historical price movements.
- Provides better forecasting performance compared to traditional models.
Stock prices exhibit complex trends that are influenced by economic, political, and market sentiment factors. Using LSTM, we can analyze historical data to identify meaningful trends and predict future movements with greater accuracy.
Required Libraries
To get started, install the necessary Python libraries:
pip install streamlit yfinance numpy pandas pandas-ta tensorflow scikit-learn plotlyImporting Required Libraries
import streamlit as st
import yfinance as yf
import numpy as np
import pandas as pd
import pandas_ta as ta
from sklearn.preprocessing import MinMaxScaler
from tensorflow.keras.models import Sequential
from tensorflow.keras.layers import Dense, LSTM, Dropout
from tensorflow.keras.layers import Input
import plotly.graph_objects as go
from plotly.subplots import make_subplots
from datetime import timedelta
Data Acquisition and Preprocessing
Fetching Stock Data from Yahoo Finance
def load_data(ticker, start_date, end_date):
    return yf.download(ticker, start=start_date, end=end_date, interval="1d")
Adding Technical Indicators to Enhance Model Performance
def add_indicators(df):
    df['RSI'] = ta.rsi(df['Close'], length=14)
    df['SMA'] = ta.sma(df['Close'], length=9)
    return df.ffill().bfill()
Stock market indicators such as Relative Strength Index (RSI) and Simple Moving Average (SMA) provide valuable insights into price trends, making them useful for improving model accuracy.
Scaling and Preparing Data for LSTM Input
def prepare_data(data, time_steps):
    scaler = MinMaxScaler(feature_range=(0, 1))
    scaled_data = scaler.fit_transform(data)
    X, y = [], []
    for i in range(len(scaled_data) - time_steps):
        X.append(scaled_data[i:i + time_steps])
        y.append(scaled_data[i + time_steps, 0])
    return np.array(X), np.array(y), scaler
Building the LSTM Model
We construct a 2-layer LSTM model for stock prediction:
def create_model(time_steps, n_features):
    model = Sequential([
        Input(shape=(time_steps, n_features)),
        LSTM(units=50, return_sequences=True),
        Dropout(0.2),
        LSTM(units=50, return_sequences=False),
        Dropout(0.2),
        Dense(units=25),
        Dense(units=1)
    ])
    model.compile(optimizer='adam', loss='mean_squared_error')
    return model
Training the Model
model.fit(X_train, y_train, epochs=50, batch_size=32, validation_split=0.1, verbose=1)LSTMs perform exceptionally well on sequential data like stock prices. However, proper hyperparameter tuning is necessary to enhance the model’s performance.
Making Predictions
Predicting future stock prices using the trained LSTM model:
def predict_future(model, last_sequence, scaler, n_future):
    future_predictions = []
    for _ in range(n_future):
        current_prediction = model.predict(last_sequence.reshape(1, *last_sequence.shape), verbose=0)
        predicted_price = scaler.inverse_transform([[current_prediction.item()]])[0, 0]
        future_predictions.append(predicted_price)
    return np.array(future_predictions)
Predicting stock prices is inherently uncertain. We recommend combining LSTM predictions with fundamental analysis for better decision-making.
Visualizing Results
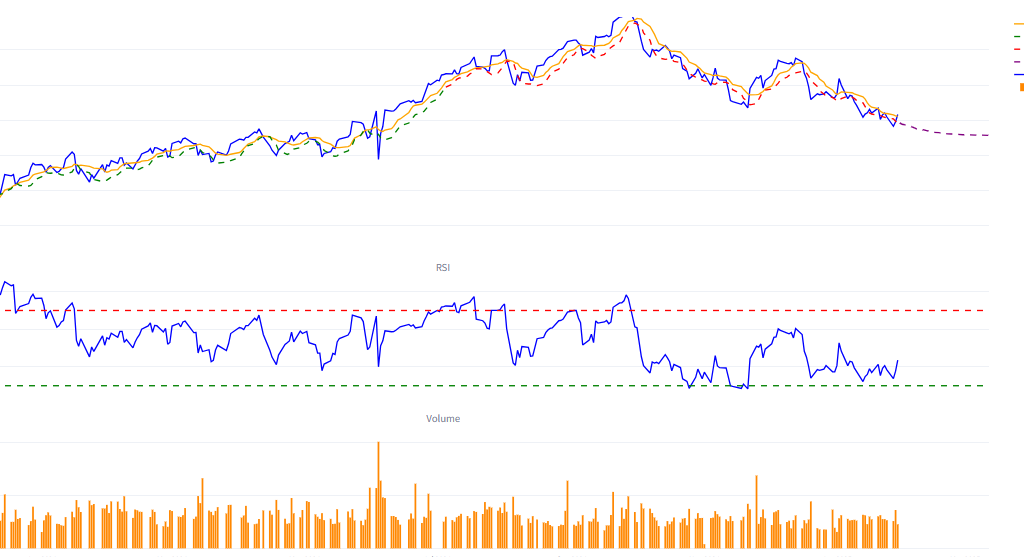
Using Plotly to create an interactive stock price visualization:
def plot_all_data(dates, actual_values, train_predictions, test_predictions, future_dates, future_predictions):
    fig = make_subplots(rows=2, cols=1, shared_xaxes=True, subplot_titles=('Stock Prices', 'RSI'))

    fig.add_trace(go.Scatter(x=dates, y=actual_values, name='Actual Price', line=dict(color='blue')))
    fig.add_trace(go.Scatter(x=future_dates, y=future_predictions, name='Future Predictions', line=dict(color='purple', dash='dash')))

    fig.update_layout(title='Stock Price Prediction', height=800, showlegend=True)
    return fig
Interactive visualizations allow traders to compare actual vs. predicted stock prices and adjust their strategies accordingly.
Deploying with Streamlit
To create an interactive web app, use Streamlit:
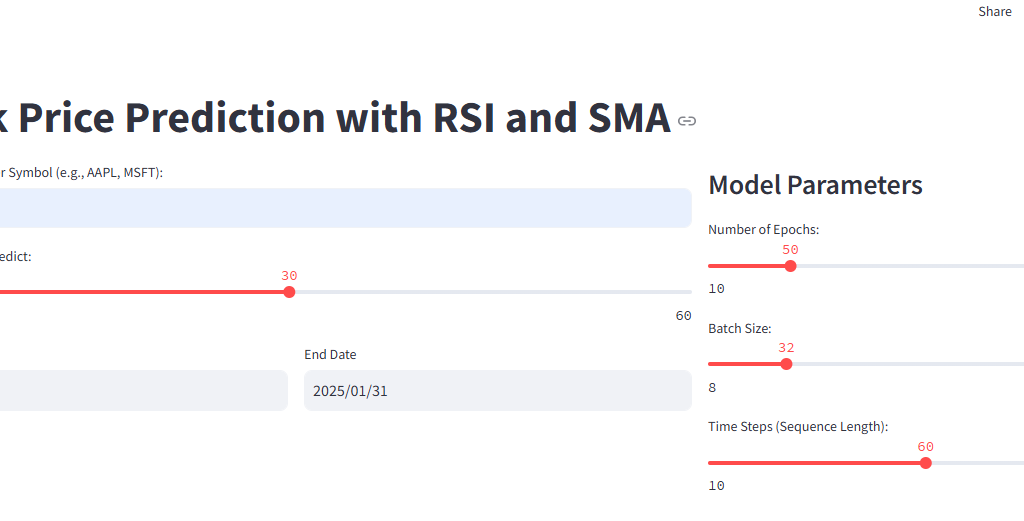
st.title("Stock Price Prediction with LSTM")
ticker = st.text_input("Enter Stock Ticker:", "AAPL")
start_date = st.date_input("Start Date", pd.to_datetime("2021-01-01"))
end_date = st.date_input("End Date", pd.to_datetime("2024-12-31"))
future_days = st.slider("Future days to predict:", 1, 60, value=30)
Run the Streamlit app with:
streamlit run app.pyStreamlit makes deployment seamless, allowing users to interact with the model without requiring extensive technical knowledge.

Conclusion
By combining LSTM networks with technical indicators, we can build an effective stock price prediction system. With Streamlit, this model becomes an interactive web application that allows users to experiment with stock data in real-time. The integration of visualization tools like Plotly further enhances the user experience.
Further Reading
By leveraging AI-driven forecasting, traders and investors can make more data-informed decisions in the stock market.
For More such content visit us.


